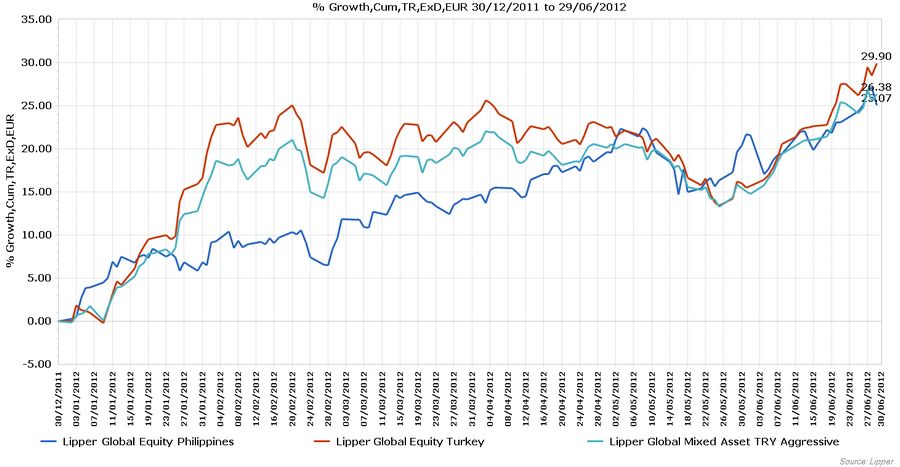
Mit +29,90 Prozent Performance im per Ende Juni 2012 erzielte die Gruppe der Türkei Aktienfonds das beste Ergebnis aller Assetklassen. Ihnen folgen Mixed Asset TRY Aggressive (türkische Lira) mit +26,38 Prozent, gefolgt von Aktienfonds aus den Philippinen mit +25,07 Prozent auf dem dritten Platz.
Das Ranking der wichtigsten Aktien-Assetklassen
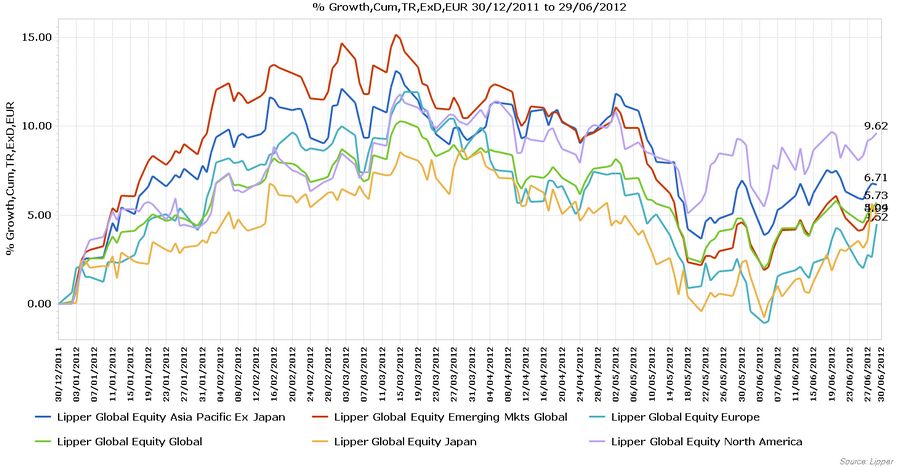
Aktienfonds mit Schwerpunkt auf die wichtigsten Regionen erzielten folgende Ergebnisse:
Platz 49: Equity North America (+9,62 Prozent)
Platz 128: Equity Asia Pacific Ex Japan (+6,71 Prozent)
Platz 166: Equity Global (+5,73 Prozent)
Platz 203: Equity Emerging Mkts Global (+5,04 Prozent)
Platz 206: Equity Japan (+4,99 Prozent)
Platz 226: Equity Europe (+4,52 Prozent)
Das Ranking der besten Anleihen-Assetklassen
Im Anleihenbereich lagen Bond TRY mit +11,71 Prozent im Ranking auf Platz 29 und werden damit als erste Anleihenklasse geführt, gefolgt von Bond Emerging Markets Europe mit +11,40 Prozent (Platz 33) und Bond Europe High Yield mit +9,94 Prozent (Platz 43).
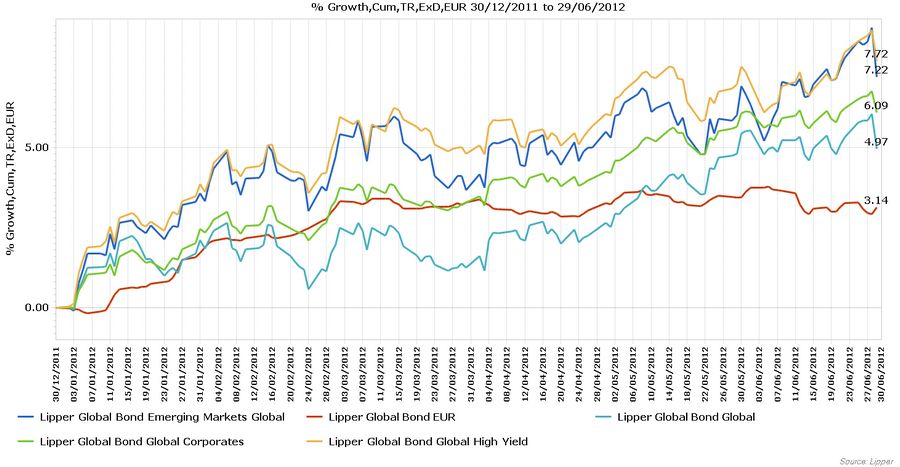
Platz 91: Bond Global High Yield (+7,72 Prozent)
Platz 111: Bond Emerging Markets Global (+7,22 Prozent)
Platz 157: Bond Global Corporates (+6,09 Prozent)
Platz 207: Bond Global (+4,97 Prozent)
Platz 288: Bond EUR (+3,14 Prozent)
3 Länder Wertung D-A-CH
Die 3-Länder-Wertung der Aktienfonds aus Österreich, Deutschland und der Schweiz zeigt per Ende Juni des Jahres 2012 folgendes Ergebnis:
Platz 109: Equity Germany (+7,24 Prozent)
Platz 174: Equity Switzerland (+5,66 Prozent)
Platz 255: Equity Austria (+3,92 Prozent)
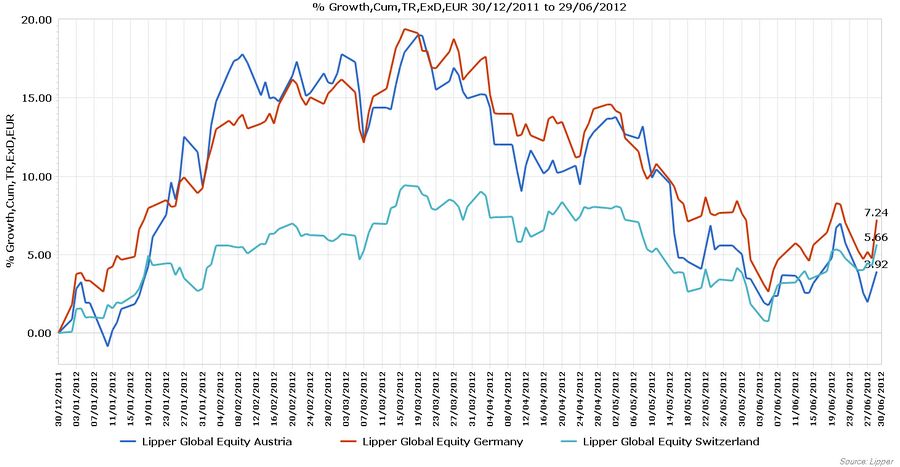
Bei der 3-Länder-Wertung gab es im Juni 2012 im Vergleich zum April 2012 keine Verschiebungen. Schweiz Aktienfonds konnten mit 5,66 Prozent wieder den zweiten Platz erreichen (Vormonat +3,46 Prozent). Deutschland auf Platz eins legte leicht von +7,11 auf +7,24 Prozent zu. Auch Österreich Aktienfonds konnten einen leichten Anstieg von +3,44 auf +3,92 Prozent verzeichnen.
BRIC Länder weiterhin auf den hinteren Rängen
Im ersten Halbjahr 2012 lagen die vier BRIC-Länder auf den folgenden Positionen:
Platz 40: Equity India (+10,35 Prozent)
Platz 211: Equity China (+4,91 Prozent)
Platz 317: Equity Brazil (+2,36 Prozent)
Platz 404: Equity Russia (-0,44 Prozent)
Performance weiterer wichtiger Assetklassen
Nordic Equity
Platz 35: Dänemark-Aktienfonds (+11,06 Prozent)
Platz 44: Norwegen-Aktienfonds (+9,86 Prozent)
Platz 127: Schweden-Aktienfonds (+6,72 Prozent)
Platz 293: Finnland-Aktienfonds (+3,08 Prozent)
Platz 332: Niederlande-Aktienfonds (+2,12 Prozent)
Lateinamerika
Platz 18: Mexiko-Aktienfonds (+13,83 Prozent)
Platz 121: Chile-Aktienfonds (+6,90 Prozent)
Platz 428: Argentinien-Aktienfonds (-11,36 Prozent)
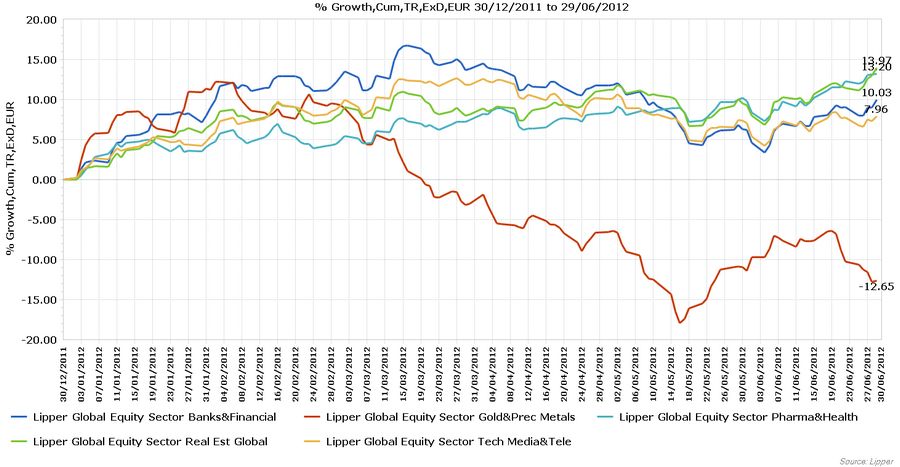
Sektoren
Platz 23: Equity Sector Pharma&Health (+13,20 Prozent)
Platz 17: Equity Sector Real Est Global (+13,97 Prozent)
Platz 42: Equity Sector Banks&Financial (+10,03 Prozent)
Platz 83: Equity Sector Tech Media&Tele (+7,96 Prozent)
Platz 430: Equity Sector Gold&Prec Metals (-12,65 Prozent)


Corporates
Platz 81: Unternehmensanleihen GBP (+7,98 Prozent)
Platz 130: Unternehmensanleihen USD (+6,68 Prozent)
Platz 215: Unternehmensanleihen EUR (+4,879 Prozent)
Die schlechtesten Assetklassen
Am untersten Ende des Rankings waren per Ende Juni 2012 Sektor Gold und Edelmetall Aktienfonds mit einer Performance von -12,65 Prozent. Davor lagen Spanien Aktienfonds mit -12,26 Prozent und Argentinien Aktienfonds mit -11,36 Prozent Performance.
Alle Daten per 30.06.2012 / Quelle: Lipper for Investment Management (LIM)