Im Durchschnitt über alle 449 Lipper-Global Assetklassen konnte im Year-to-date (YTD) Betrachtungszeitraum per 29.03.2013 ein Performancewachstum von + 4,22 Prozent verzeichnet werden. 385 der insgesamt 449 Anlagekategorien konnten seit Jahresbeginn ein Wachstum verzeichnen (entspricht einem Anteil von 85,75 %).
Aktienfonds bisher am erfolgreichsten
Aktienfonds ("Equity") konnten sich bislang am erfolgreichsten entwickeln: Im Durchschnitt über alle 113 Aktienfondskategorien konnte YTD ein sattes Plus von + 7,12% generiert werden. Eine detaillierte Übersicht der bisherigen durchschnittlichen Performanceentwicklung aller wichtigen Assetklassen finden Sie in folgender Tabelle: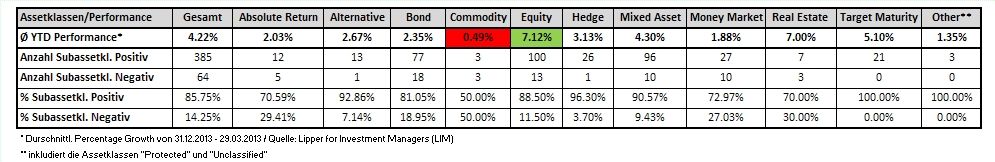
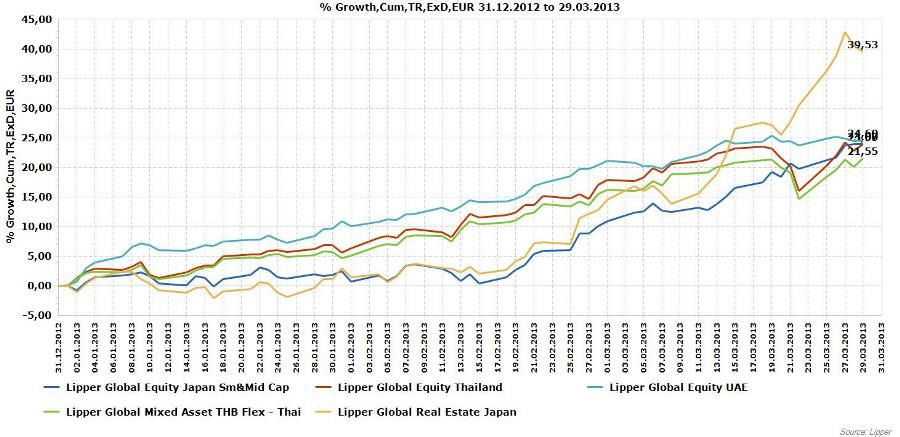
Top-5 Anlageklassen: Eine rein Asiatische Angelegenheit
Seit Jahresbeginn am profitabelsten waren bislang Japan Immobilienfonds (Platz 1) sowie Aktienfonds mit Fokus auf die Vereinigten Arabischen Emirate sowie Thailand (Platz 2 & 3).
| Platz 1: Real Estate Japan (+39.53 Prozent) |
| Platz 2: Equity UAE (+24.6 Prozent) |
| Platz 3: Equity Thailand (+24 Prozent) |
| Platz 4: Equity Japan Sm&Mid Cap (+23.97 Prozent) |
| Platz 5: Mixed Asset THB Flex - Thai (+21.55 Prozent) |
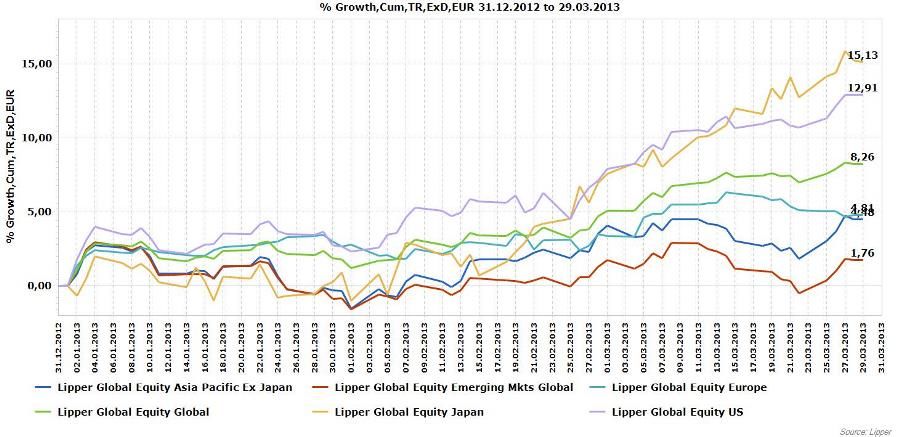
Performance weiterer wichtiger Aktienfondskategorien
| Platz 16: Equity Japan (+15.13 Prozent) |
| Platz 22: Equity US (+12.91 Prozent) |
| Platz 75: Equity Global (+8.26 Prozent) |
| Platz 173: Equity Europe (+4.81 Prozent) |
| Platz 189: Equity Asia Pacific Ex Japan (+4.48 Prozent) |
| Platz 310: Equity Emerging Mkts Global (+1.76 Prozent) |
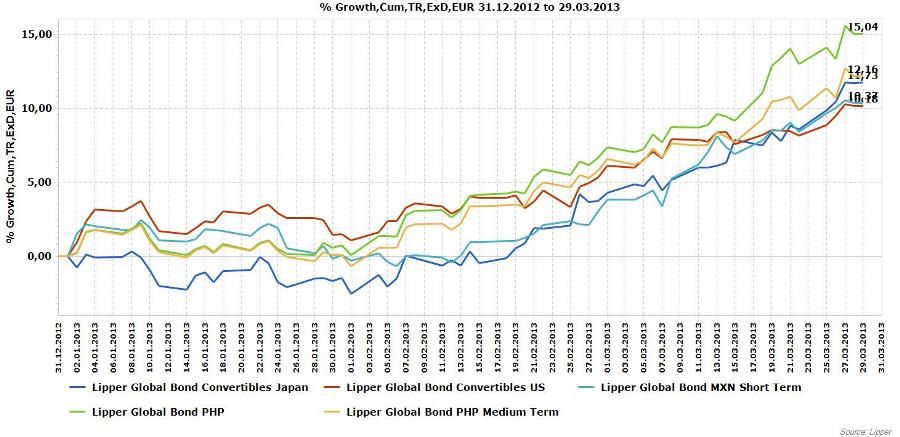
Die besten Anleihenfondskategorien seit Jahresbeginn
| Platz 17: Bond PHP (+15.04 Prozent) |
| Platz 27: Bond PHP Medium Term (+12.16 Prozent) |
| Platz 29: Bond Convertibles Japan (+11.73 Prozent) |
| Platz 39: Bond MXN Short Term (+10.37 Prozent) |
| Platz 43: Bond Convertibles US (+10.18 Prozent) |
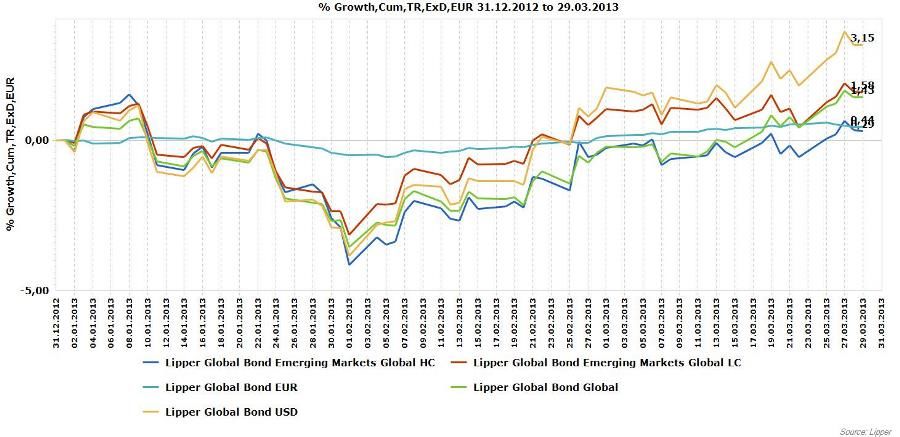
| Platz 241: Bond USD (+3.15 Prozent) |
| Platz 317: Bond Emerging Markets Global LC (+1.58 Prozent) |
| Platz 320: Bond Global (+1.43 Prozent) |
| Platz 365: Bond EUR (+0.44 Prozent) |
| Platz 376: Bond Emerging Markets Global HC (+0.29 Prozent) |
| Platz 23: Equity Switzerland (+12.64 Prozent) |
| Platz 231: Equity Germany (+3.4 Prozent) |
| Platz 418: Equity Austria (-2.08 Prozent) |
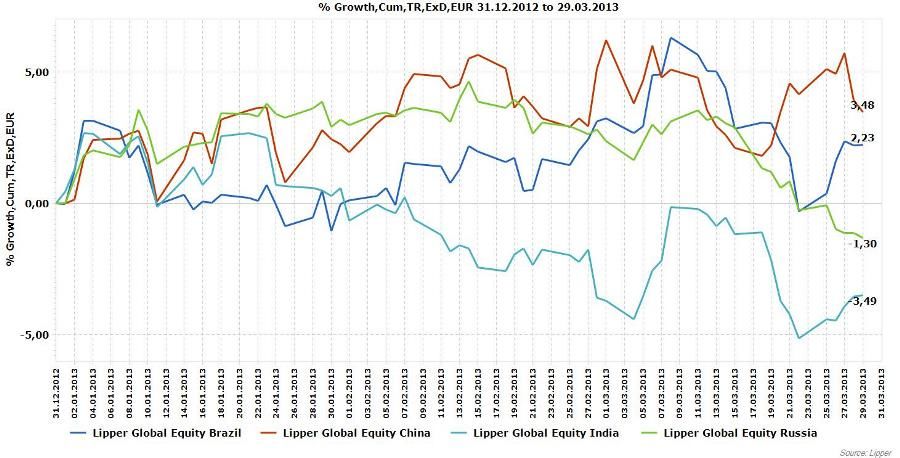
BRIC-Aktienfonds im Vergleich
| Platz 227: Equity China (+3.48 Prozent) |
| Platz 288: Equity Brazil (+2.23 Prozent) |
| Platz 412: Equity Russia (-1.3 Prozent) |
| Platz 436: Equity India (-3.49 Prozent) |
Performance weiterer wichtiger AssetklassenNordic Equity
| Platz 25: Equity Denmark (+12.36 Prozent) |
| Platz 41: Equity Sweden (+10.3 Prozent) |
| Platz 80: Equity Finland (+8.13 Prozent) |
| Platz 191: Equity Norway (+4.35 Prozent) |
| Platz 322: Equity Netherlands (+1.38 Prozent) |
Lateinamerika
| Platz 14: Equity Argentina (+15.37 Prozent) |
| Platz 55: Equity Mexico (+9.57 Prozent) |
| Platz 100: Equity Chile (+7.25 Prozent) |
Sektoren
| Platz 13: Equity Sector Pharma&Health (+15.4 Prozent) |
| Platz 74: Equity Sector Tech Media&Tele (+8.29 Prozent) |
| Platz 78: Equity Sector Banks&Financial (+8.16 Prozent) |
| Platz 92: Equity Sector Real Est Global (+7.44 Prozent) |
| Platz 449: Equity Sector Gold&Prec Metals (-13.05 Prozent) |
Unternehmensanleihen
| Platz 263: Bond USD Corporates (+2.73 Prozent) |
| Platz 355: Bond EUR Corporates (+0.59 Prozent) |
| Platz 425: Bond GBP Corporates (-2.56 Prozent) |
Die schlechtesten Assetklassen
Das Negativ-Ranking wird in diesem Monat erneut von Gold- und Edelmetall Aktienfonds angeführt (mit einer YTD Performance von -13.05 Prozent abgeschlagen auf Platz 449). Das Ranking wird von folgenden Anlagekategorien vervollständigt:
| Platz 449: Equity Sector Gold&Prec Metals (-13.05 Prozent) |
| Platz 448: Hedge/Fixed Income Arb-FoHF (-7.26 Prozent) |
| Platz 447: Equity Egypt (-6.99 Prozent) |
| Platz 446: Money Market JPY (-5.46 Prozent) |
| Platz 445: Bond Global JPY Hedged (-4.81 Prozent) |
Alle Daten per 29.03.2013 / Quelle: Lipper for Investment Management